Analytics & Reporting System
Unlocked data-driven decision-making across support and sales operations, improving overall team performance
Context
Zoko helps businesses run marketing campaigns, automation, and customer conversations on WhatsApp.
But users lacked visibility into how these efforts were performing - especially in terms of revenue and ROI. They needed a simple way to understand what’s working and where to focus.
Key Problems
• No clear visibility into revenue generated through Zoko
• Difficult to connect actions (broadcasts, flows, chats) with outcomes
• Data was scattered and hard to interpret
• Users struggled to understand ROI and performance
Why This Problem Is Important
For most businesses, the key question is simple:
"Is this making me money?" Without clear answers, users lose confidence and struggle to make decisions.
Design Approach
We prioritised visibility and operational clarity over minimal visual design.
User testing showed that in high-volume environments, users prefer:
1) Focus on clarity over complexity
2) Highlight key metrics like revenue and ROI
3) Break down performance by feature (broadcasts, flows, chats)
3) Make data easy to scan and compare
Solution Overview
Designed a centralized analytics dashboard that shows revenue, ROI, and performance across different parts of the product. The goal was to give users a quick understanding of how Zoko is impacting their business.
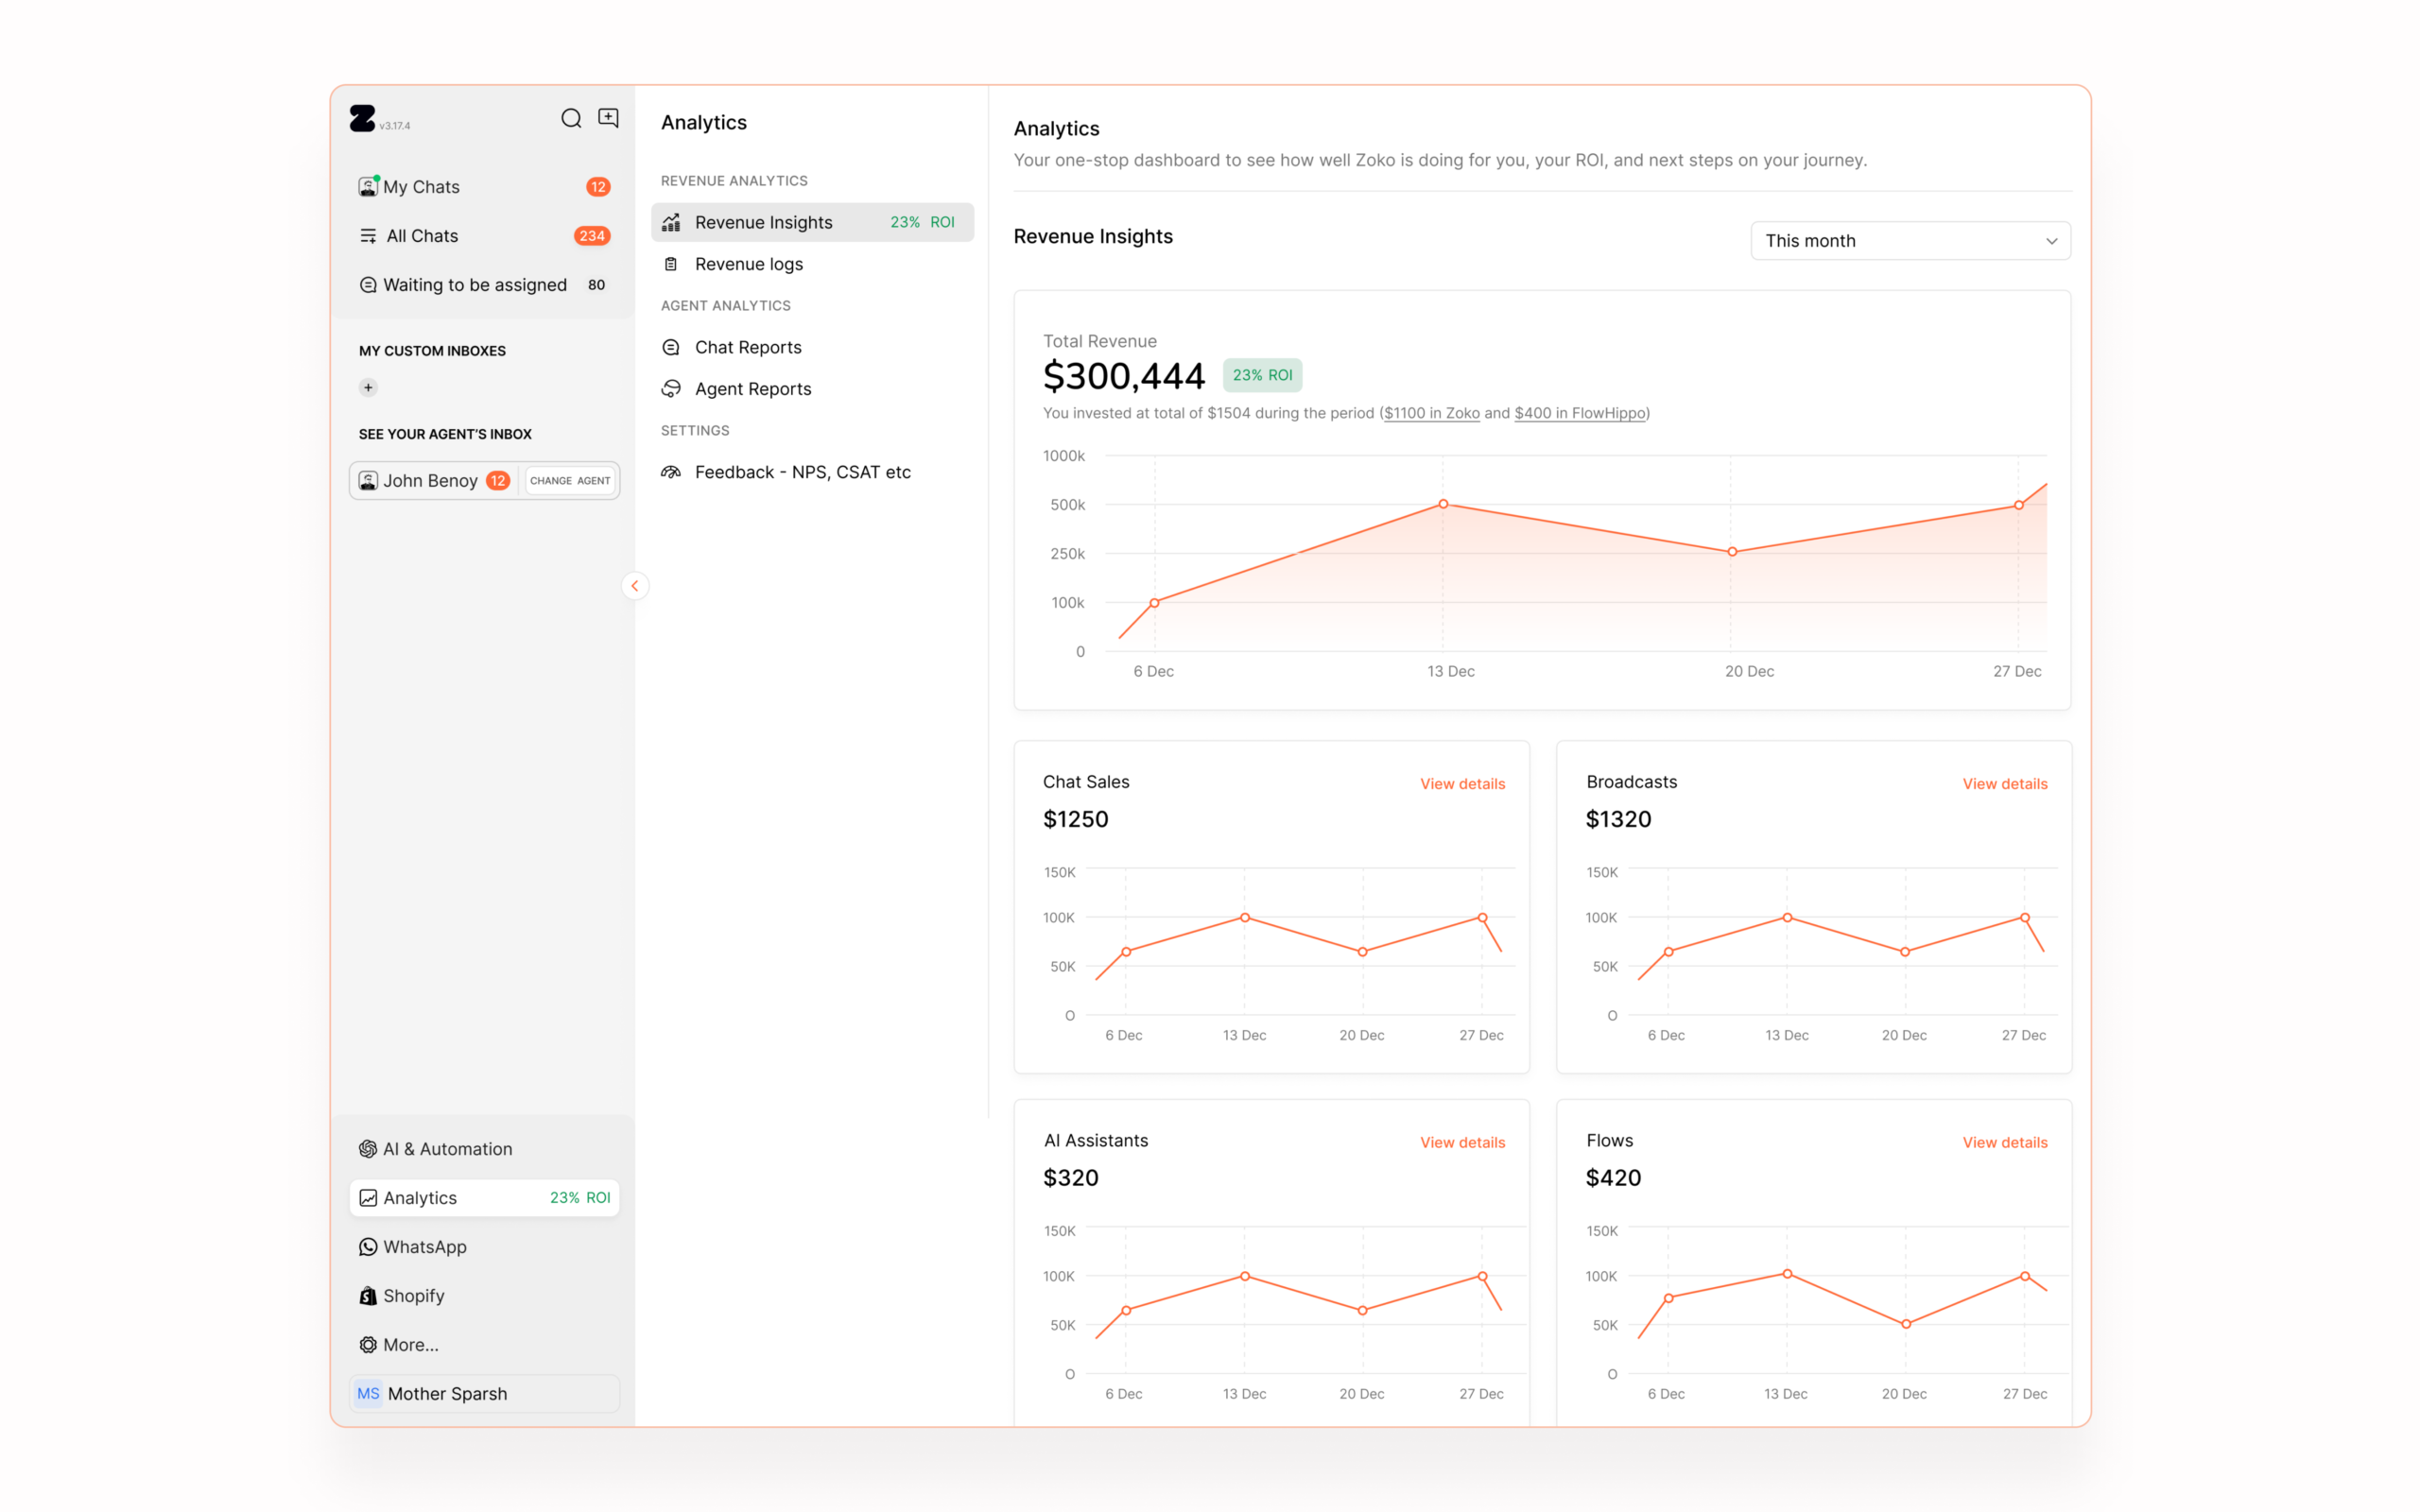
Revenue Insights (Top Level)
Shows total revenue and return on spend, helping users quickly understand overall performance.
Performance Breakdown
Breaks down revenue across different features like broadcasts, flows, chat sales, and AI assistants.
This helps users understand which part of the product is driving results.
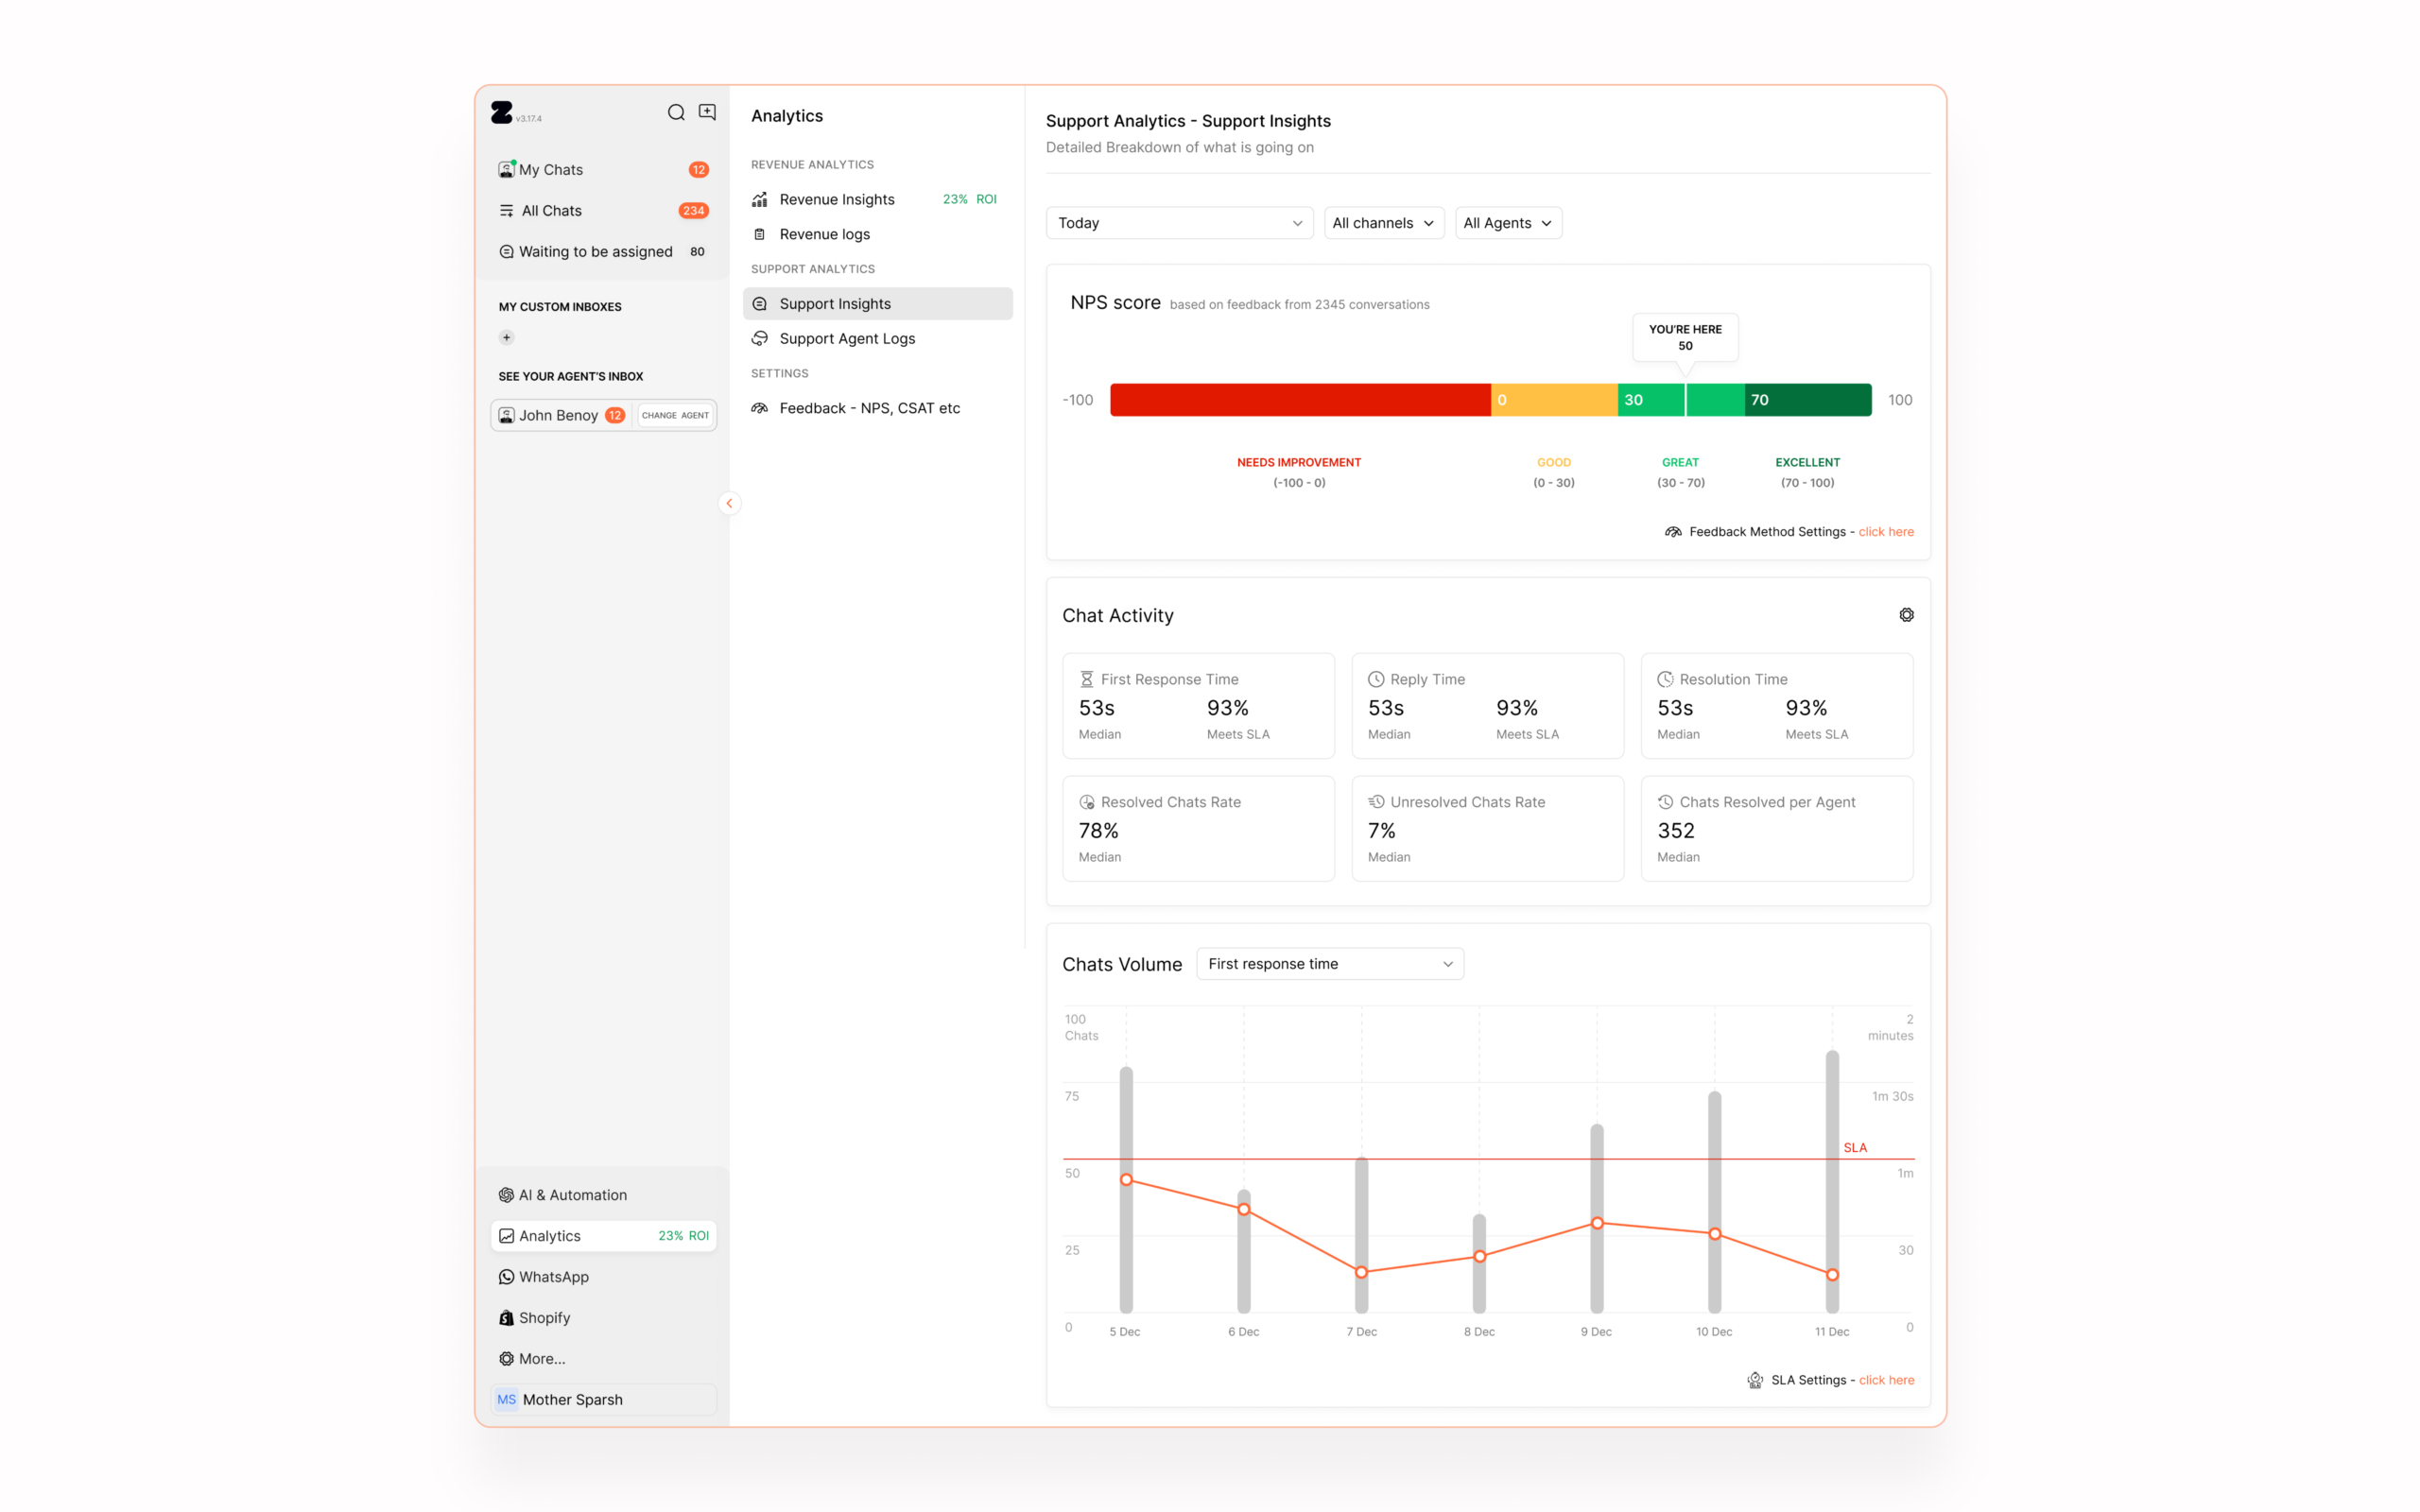
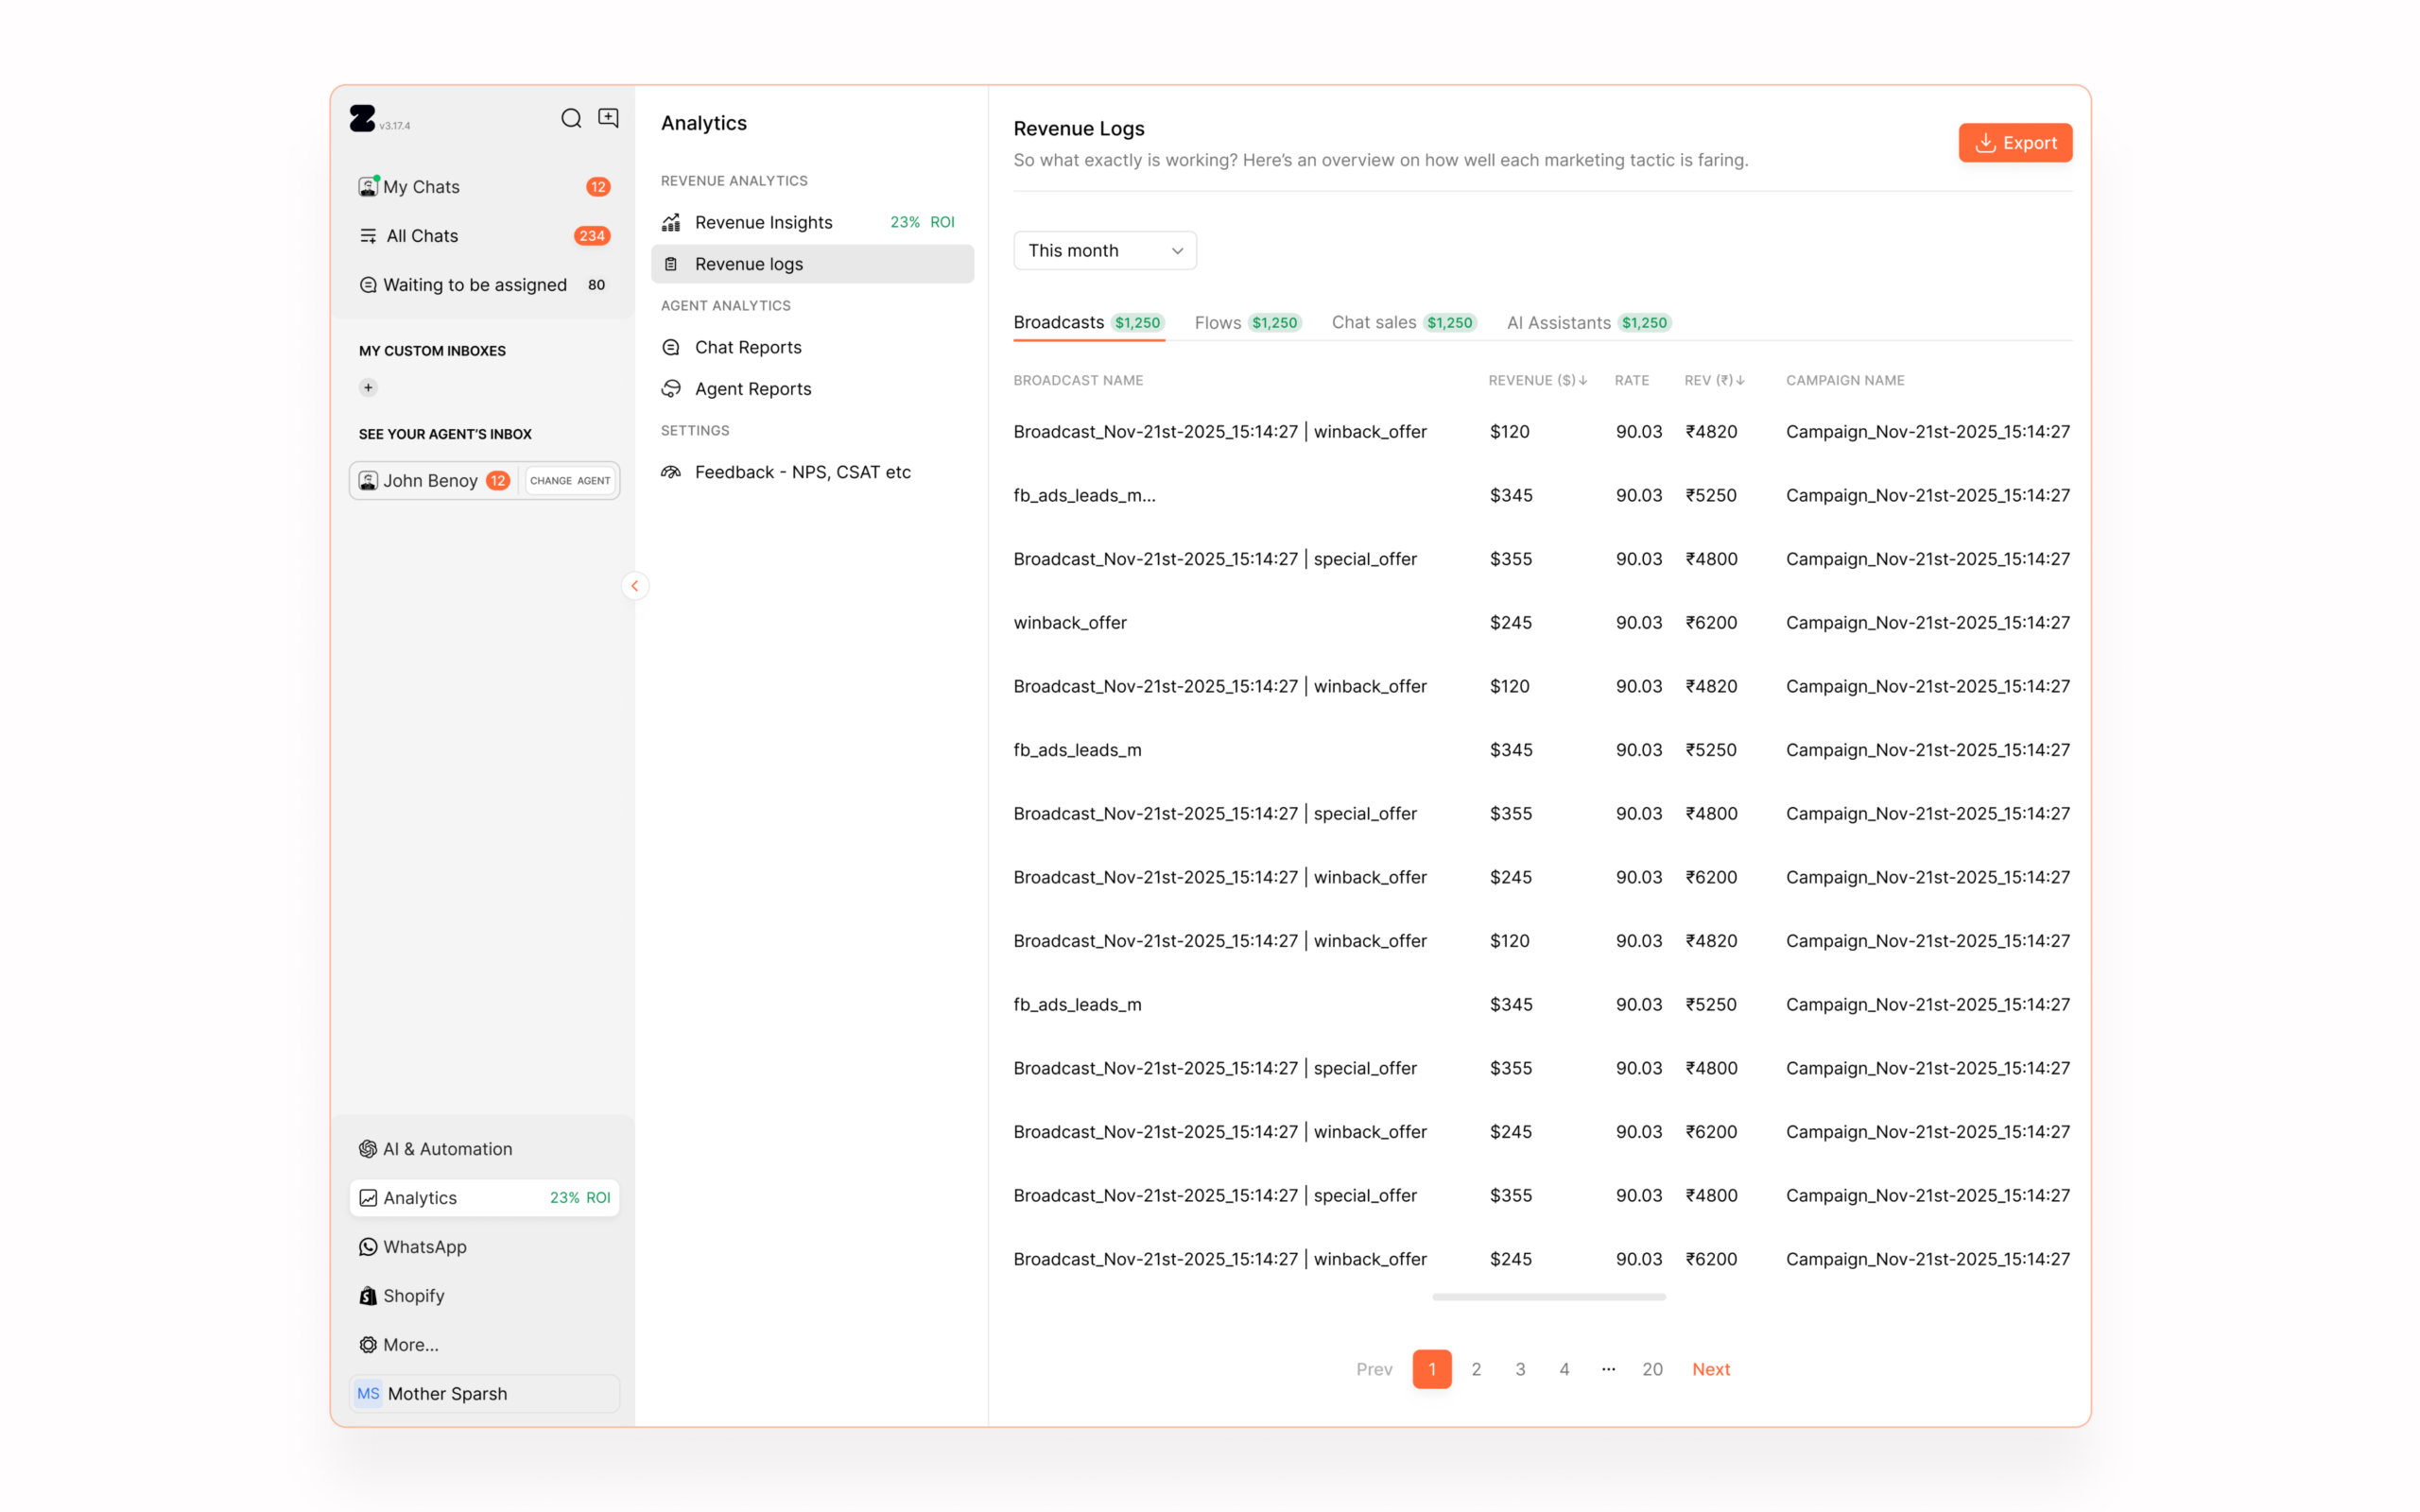
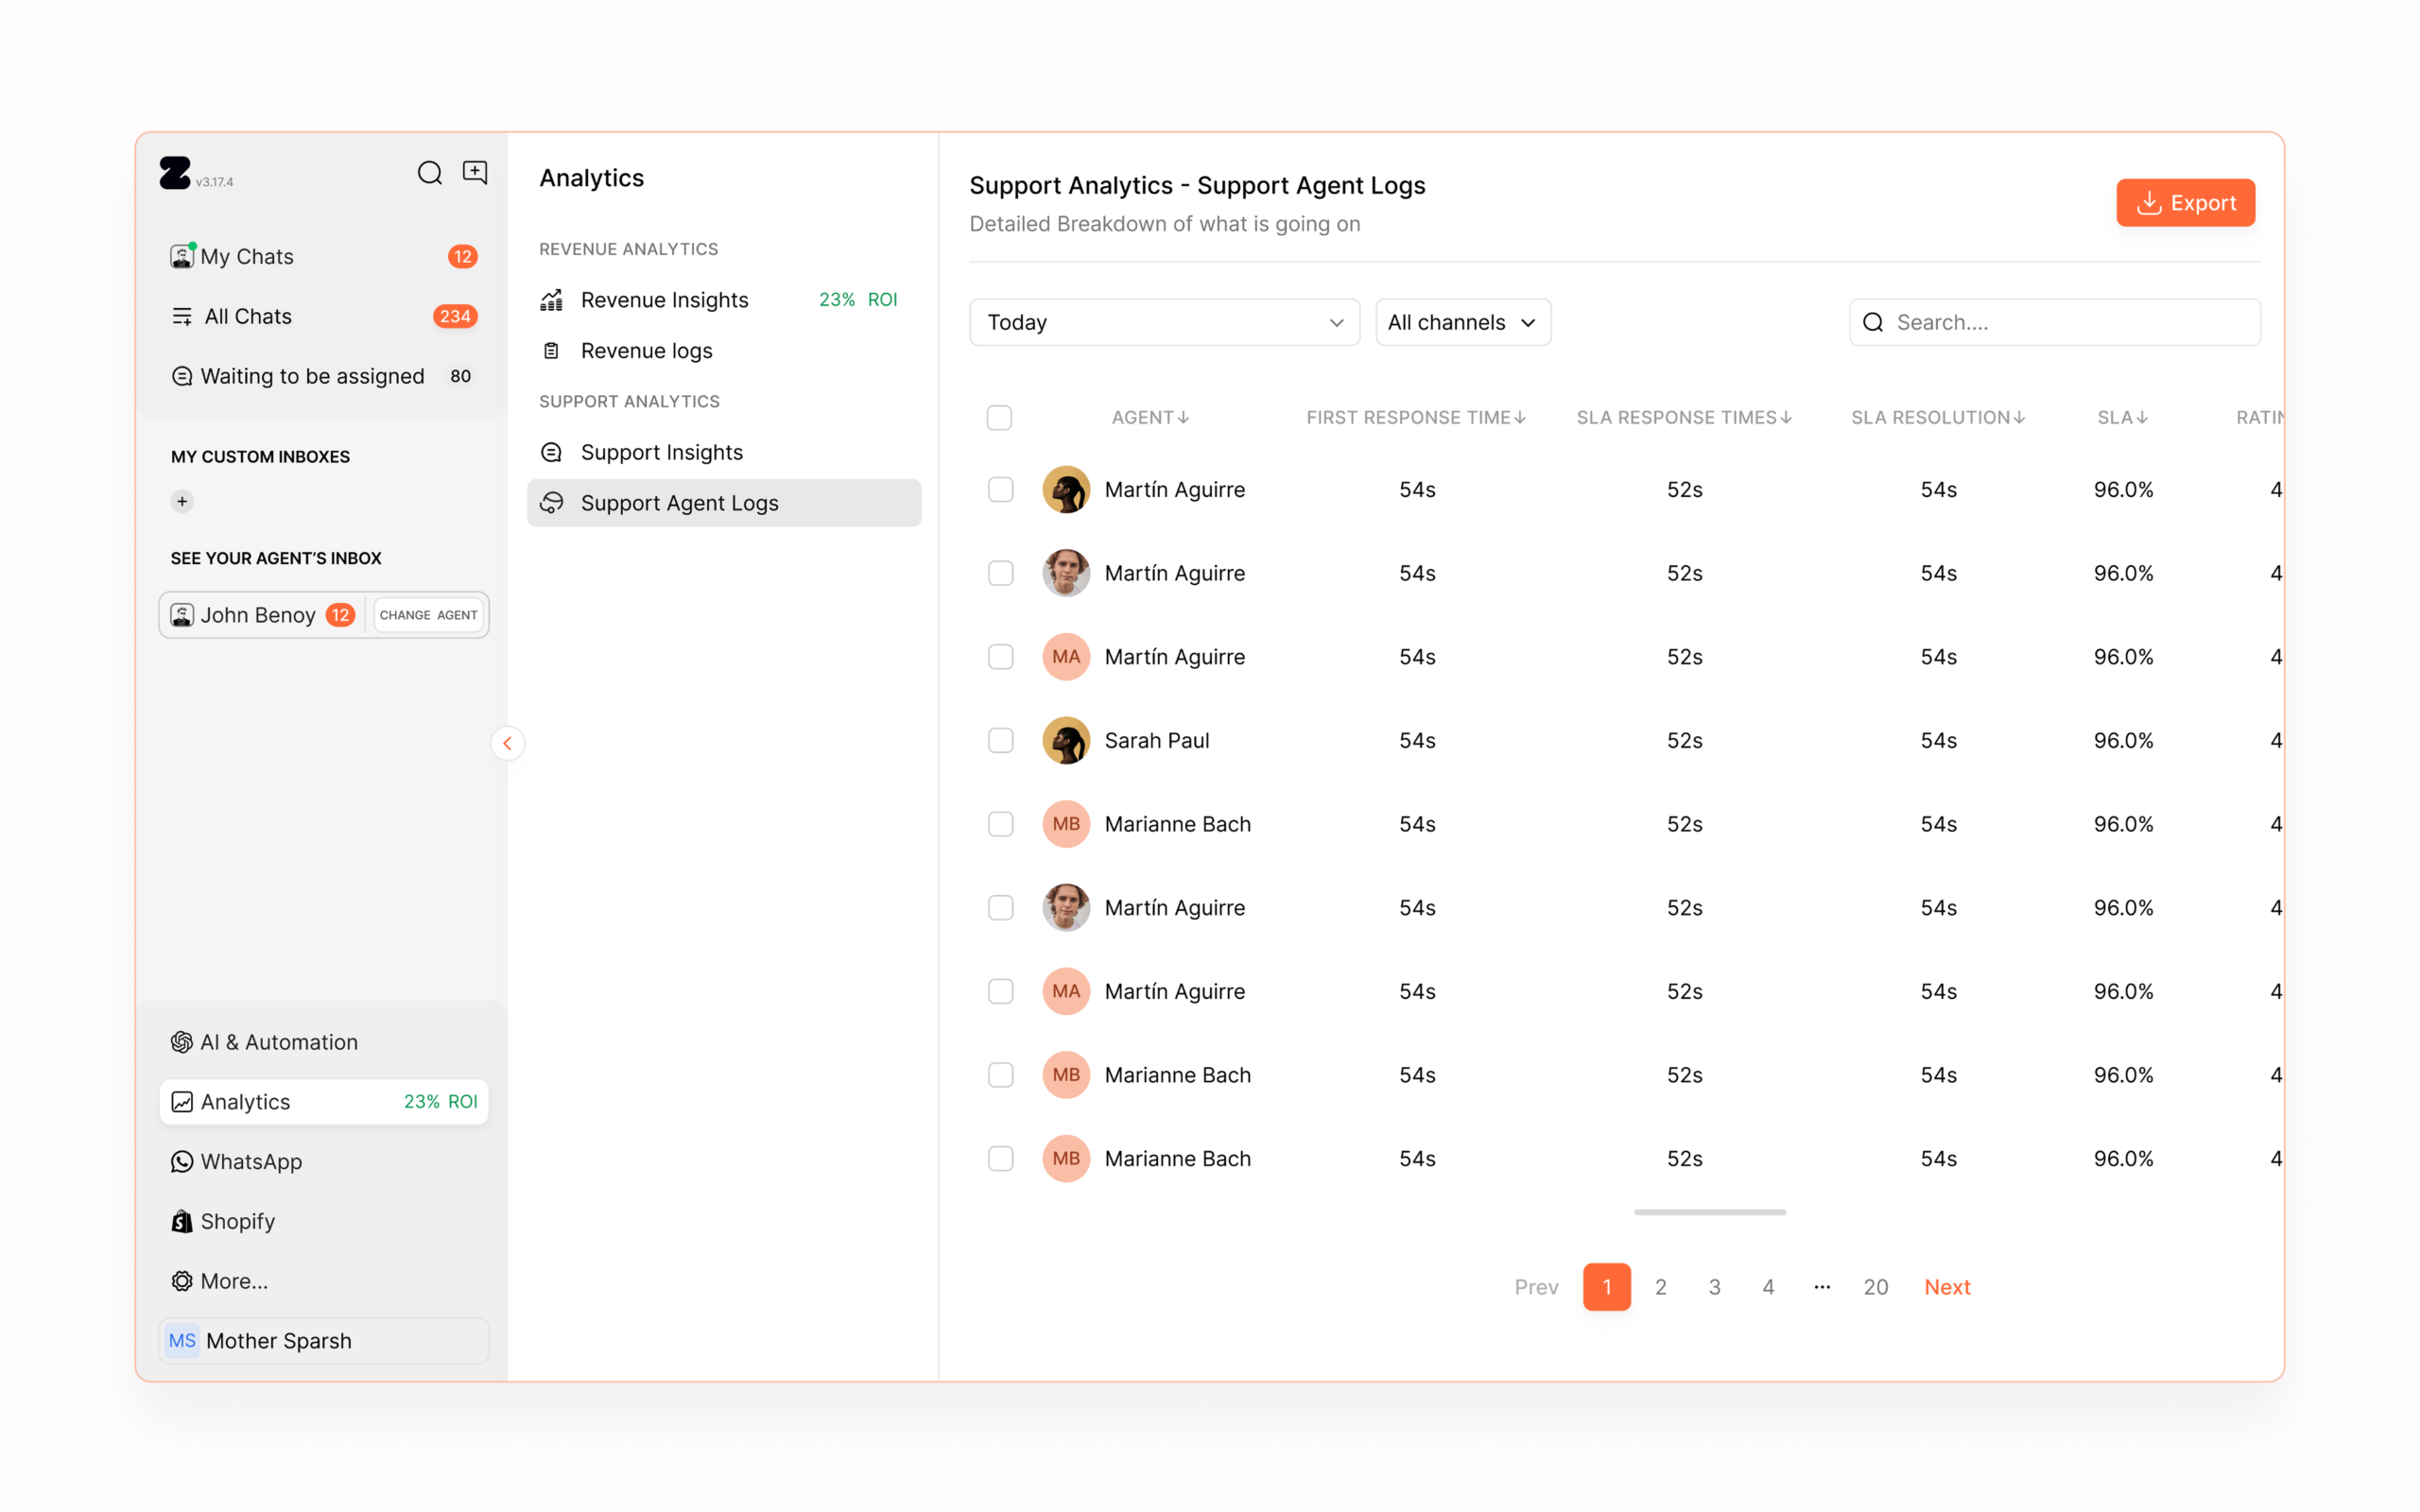
Detailed Reports
Provides detailed data on campaigns, including revenue, conversion rate, and performance.
This allows users to go deeper and analyze specific campaigns.
Time-Based Insights
Users can view performance over time to track trends and understand growth.
Key Design Decisions
• Prioritized key metrics like revenue and ROI instead of overwhelming users with data
• Grouped data by product features for better understanding
• Used simple visualizations to make trends easy to read
• Balanced high-level insights with detailed breakdowns
Before → After
Before:
- No clear visibility into performance
- Data scattered across different areas
- Difficult to measure ROI
After:
- Centralized analytics dashboard
- Clear revenue and ROI visibility
- Easy to understand performance across features
Impact
- Improved visibility into business performance
- Helped users understand ROI clearly
- Enabled better decision-making
- Increased confidence in using the product
What I Learned
Analytics is not about showing more data - it’s about showing the right data so users can make decisions quickly.
Let’s build thoughtful, scalable products.
Open to senior IC and design leadership roles. If you're building something interesting, let’s talk.
📱 +91 9847580241
📄 Resume
Elsewhere:
© 2026 Sooraj. Designed with intention.